Over the past year and a half I have been educating myself on the various open sourced tools / libraries / software that exist for collecting, managing/cleaning, analyzing, and visualizing geospatial data. I have learned through various resources: blog tutorials, YouTube videos, conferences, academic papers, and work. In this post I will share with you the main tools I use for my work. This guide is aimed for beginners in the GIS field.
If you don’t feel like reading all the details, feel free to go to the Tools section where I list all the tools I use.
If you learn through doing, I wrote a tutorial that shows how to build an interactive Mapbox GL JS React map.
Data Collection
Data
The data I handle is either implicitly or explicitly georeferenced, or both. By implicit, I mean the geographic reference (i.e., the reference to place or space) is implied through text, such as text in a tweet or the tweeter's profile location. By explicit, I mean the geographic reference is implied through geographic coordinates, which assigns it to a specific place on Earth's surface.
The following are the primary data types that I have encountered: geojson / json, osm xml /pbf, shp, kml / kmz, mbtiles, and csv.
Data Sources
I collect the data through various sources. If I am working for a client, they usually provide me with the data; but, for my own projects, I search for data from the following sources:
- Municipal, provincial/state, and federal open data portals
- International organization's open data portals (e.g., World Bank, World Wildlife Fund)
- OpenStreetMap (OSM)
- Text mining / scraping (e.g., Twitter, Kijiji ads)
Data Extraction / Clean
There are various ways to extract the data from the sources listed above. Some methods require more technical experience, such as using the command line, while others offer a user-friendly graphical interface to extract data.
The government data I mostly work with are from Canadian government entities, like municipalities or federal departments. Most of these sources, as well as other international organizations, usually release static data (like a dump file). You can download the data through their open data portals. The data is downloaded from the browser onto your computer for use.
However, more government entities are releasing their data through application programming interfaces (APIs), which allows users to stream the data. For example, the map in the about section visualizes live streaming data from NRCan's Earthquake API. I also follow this bot created by James McKinney that tweets whenever any Canadian government releases a new repo. Although APIs / repos require more technical experience, they allow governments to start providing real-time data.
OSM is a global wiki-like project that aims to map all features on Earth's surface through points/nodes, lines/ways, and polygons/enclosed ways. OSM objects' attributes are stored through tags. OSM's database is open for anyone to use as long as it is in accordance to its license. OSM has a growing number of contributors, which includes cartographers, governments, and private and public companies.
I usually extract the data from Geofabrik. Geofrabik allows your to download OSM data based off geographic region (i.e. planet, continent, countries, and you can download at smaller geographies in specific countries). The data can be downloaded as an osm xml or pbf. I usually download it as an osm xml (or .osm) and then convert it into GeoJSON using minjur from the command line:
minjur mexico-latest.osm.pbf > mexico.geojson
Sometimes I have to download the planet file to get to the geographic region I need. In this case the data is too big to handle, so before I do any processing I clip the planet file within a bounding box or polygon. I use osmosis or osmium to clip the data. To determine the bounding box, I use this tool. For example, I use the following script to clip an osm file to the correct geographic region I need:
osmosis --read-xml mexico-latest.osm --bounding-box top=18.68111038213857 left=-98.55468750022783 bottom=14.550546646410794 right=-90.38444519009329 --write-xml oaxaca-and-chiapas.osm
It is important to consider whether you should download the data as a bounding box or polygon. Bounding boxes can be easier to extract data, but it also can cause additional or missing data for a geographic region. For instance, if I need to collect data for a city, I would use a polygon of the municipality's boundary lines over a bounding box. A bounding box does not give a realisitic reprentation of a place.
You can also download OSM data from Mapzen Metro Extracts or Humanitarian OSM Team Export Tool or JOSM as GeoJSONs. These options allow you to avoid the command line if you do not feel comfortable using it.
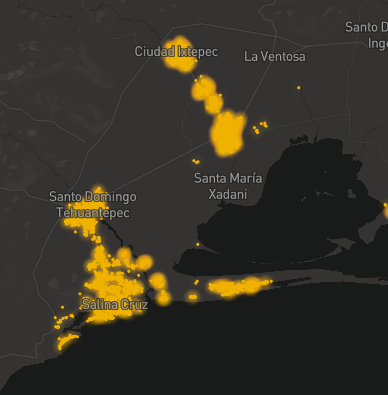
For text mining / scraping. There are various methods for extracting text from a source, but in my case I have used tweets as a source of georeferenced data. You can mine tweets through Twitter's Streaming API. There are various ways to use the API and store the tweets. In my case I followed a similar method as this tutorial. Tweets and other social media platforms have become sources for both implicit and explicit georeferenced user-generated content. That said, there are some holes in these mined datasets, even if you can collect millions of objects. For instance, most social media posts are not explicitly georeferenced (i.e., not geotagged). To get enough georeferenced tweets, one should then assess other ways to extract the geographic informations, but these other mechanisms can enforce assumptions. For example, I assumed a user's profile location is where the tweet was located, but that may not necessarily be the case. Even my own Twitter profile's location is not where I am currently residing!
Data Management
Data Storage
I decide what method to store my data in based off the size and type.
If I am working with a small dataset (< 1,000 objects with few attributes), I usually handle the data through JavaScript on the browser. I will store the data in a Google Sheet or GeoJSON. I then use AJAX's get function to pull the data from a url:
I have also used Google Sheets and Google Fusion Tables to store data and pull into a JavaScript. I wrote a tutorial for this methodology. This method is easy for people to input new data, but it does have a limit as there is no server functionality, the data is still being pulled to the browser. I avoid using this method with larger datasets because the browser will run out of memory and choke.
For datasets larger than 1,000 objects, I use PostGIS or MBTiles. PostGIS is useful because you can run various pre-existing algorithmns to manage your data, and if you do not feel comfortable handling the data from Terminal, you can use pgAdmin, which is a graphical interface to manage your PostGIS database. You can see how I have used PostGIS for handling data here.
If visualizing the data is more important than the storage and analaysis of the data, I use MBTiles. I usually modify my MBTiles using Mapbox Studio or GL JS. I use Mapbox Studio to style my map layer and add my MBTiles, but I use Mapbox GL JS library in JavaScript / React to interact with the data from the browser. This is detailed more in the Data Visualization section.
Data Cleaning
UNIFORM PROJECTION
UNIFORM FILE FORMAT
MERGE / JOIN DATA
Since I usually get my data from various sources I have to first make sure the data is uniform before I merge them for analysis. This will reduce any data inconsistencies that can skew the data. In general, the following are the mains steps I complete:
- STEP 1: Reproject the data in the same projection. I usually stick with EPSG 4362: WGS 84 because it is a consistent projection most people use (e.g., Google, Mapbox). I usually just change the projection in QGIS, but other libraries exist that I have also used in the past, such as GDAL.
- STEP 2: Convert the data into the same file format (e.g., GeoJSONs or shapefiles). I also use QGIS for this, but ogr2ogr, osmosis, minjur all work as well.
- STEP 3: Merge datasets, usually by spatial join or matching field names. This step can be completed in QGIS, with GDAL, or in PostGIS.
After the data is all cleaned and formatted accordingly, I can analyze the data!
Data Analysis
The following are tools I use to spatially analyze data:
- QGIS with the stat tools,
- PostSQL / PostGIS
- R / RStudio
- Esri software
QGIS is an open sourced graphical interface for managing, analyzing, and visualizing geospatial data. It uses the GDAL library and has various extensions that can be added. More information about QGIS can be found here.
PostSQL / PostGIS is an open sourced library for storing, managing, and analyzing geospatial data. PostGIS has various alogrithms for analyzing the data, I use the documentation to know what tools exist.
In RStudio, an open sourced graphical interface to use R, can be used to store, manage, analyze, and visualize your geospatial data. There are various packages that can be used, including: ggplot2, leaflet.
Esri offers propreitary software to store, manage, analyze, and visualize geospatial data. Since it is not open sourced, I do not have the opprotunity to use this tool very often.
Data Visualization
In this section I will focus on how to visualize geospatial data as an interactive map; but, keep in mind, spatial data doesn't always need to be visualized as a map. For inspiration, I recommend checking out the following sources: D3.js examples and Reddit.
Initially I visualized spatial data as static maps using Esri's ArcMap software, but through my education I learned how to develop interactive web maps that can enhance a user's experience viewing and interpreting geographic data represented as a map.
I started developing interactive web maps using the Leaflet library. I avoided familiarizing myself with Google Maps API because Google deprecates their APIs frequently. Now I use Mapbox GL JS.
How I manage my spatial data depends on the volume, velocity, and variety of data. If the data is low volume, velocity, and variety, I will pull the data to the browser using AJAX (as shown above). An example of this can be seen here.
If the data is high volume and variety, but there is no velocity (i.e., the data is static), I will use MBTiles. I design the MBTiles as a style in Mapbox Studio and then interact with the style's layers using Mapbox GL JS. An example of this can be seen here. Also, I wrote a tutorial (crimecouver) on how I created a custom map style with Mapbox Studio and used React and Mapbox GL JS to interact and visualize the style's layers.
If my data has high volume, variety, and velocity, I store the data in PostGIS and then create a Node.js app with a RESTful API to visualize the data. An example of this can be seen here.
I will also use Google Earth to visualize low/medium volume, zero velocity, and low/medium variety KML / KMZ data that I want to be visualized in 3D. I tend to avoid Google products, but Mapbox GL JS does not support a 3D Earth surface yet. Mapbox GL JS supports extrusions, which is great for visualizing 3D buildings but poor for visualizing elevation. For example, if I wanted to show elevation I could develop an elevation profile as an extruded line with Mapbox GL JS; but, visualizing a trek on a 3D surface really tells a story about the distance and height one walked and it can be easily done on Google Earth's graphical interface.
Tools
Here is a list of most of the tools I use. Feel free to contact me if you have any recommendations!
- D3.js is an open-source library for visualizing data
- Esri proprietary software can be used to manage, analyze, and visualize geospatial data
- Geospatial Data Abstraction Library (GDAL) is an open-source library for managing geospatial data
- Geofabrik is a web site that allows you to download OSM data in different formats by different geographic scales
- geojson.io allows you to edit GeoJSONs easily
- HOT Export Tool is an "open service that creates customize extracts of up-to-date OSM data in various file formats"
- JOSM is an open-source graphic interface to contribute, edit, validate OSM data, but can also be used to extract and visualize geospatial data as well
- Leaflet is an open-source JS library to develop interactive maps
- Mapbox Studio is an open-source graphical interface for designing map layers as well as developing data-driven styling
- Mapbox GL JS is an open-source library for developing interactive web maps
- Mapbox Cartogram is an open-source tool to help design a map layer based on a reference image
- Mapzen Metro Extracts allows your to download OSM data in various file formats from various cities
- minjur is an open-source library for managing OSM data
- osmosis is an open-source library for managing OSM data
- osm2geojson is an open-source library for converting OSM data to GeoJSON(s)
- PostgreSQL / PostGIS is an open-source library to store, manage, and visualize geospatial data. PostGIS has spatial index which can decrease computational time for analysis.
- QGIS is an open-source graphical software that is similar to ArcMap. It is used to manage, analyze, and visualize spatial data. QGIS uses GDAL and you can use various extensions to conduct specific analyses or visualizations